matplotlib |
您所在的位置:网站首页 › matlab marker › matplotlib |
matplotlib
|
目录
matplotlib中marker支持的数据类型无填充形状和填充形状Tex形状Path对象使用Path模块中的Path对象自定义Path对象从svg格式转化为Path对象
参考
matplotlib中marker支持的数据类型
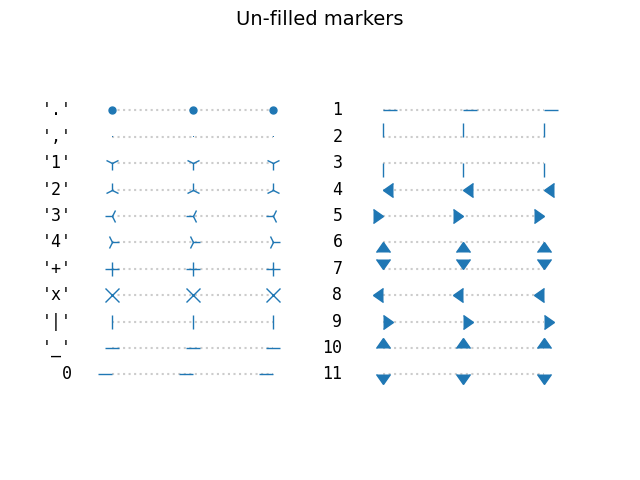
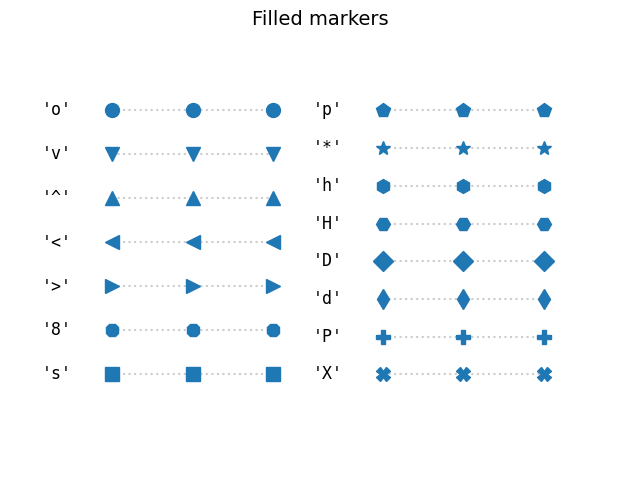
marker有4种类型,分别是: Unfilled markers: 无填充形状Filled markers: 填充形状markers created from Tex symbols: 即用tex字符串定义的形状created from paths:自定义的matplotlib中的Path对象即路径。4种类型中前两种即无填充类型和填充类型都是matplotlib本身就有的,没有可扩充性。第三种tex字符串也只能表现一些特殊的形状,可扩充性也不是很强。最后一种Path对象可以自己定义形状,可扩充性比较强。 无填充形状和填充形状使用这种形状只需给marker指定一个字符或者一个数字即可
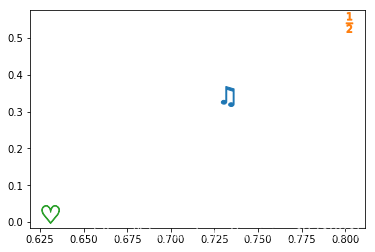
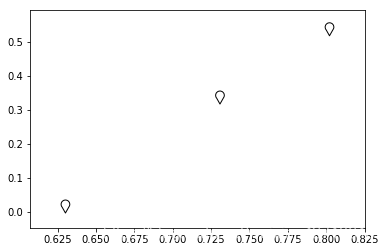
通过自定义一个符合Latex格式的字符串复制给marker即可,因此如果想让makrer为一个数字或者单词字母或者特殊的符号便可以定义这样一个字符串 import matplotlib.pyplot as plt import numpy as np data = np.random.rand(3,2) fig = plt.figure() ax = fig.add_subplot(111) markers = ["$\u266B$", r"$\frac{1}{2}$", "$\heartsuit$"] for i in range(data.shape[0]): ax.scatter(data[i,0], data[i,1], marker=markers[i], s=400) plt.show()
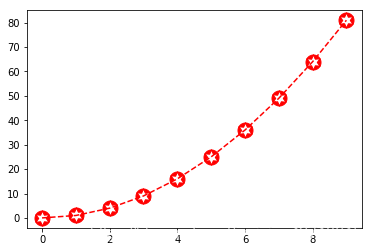
matplotlib中Path类的定义参考了图片格式svg格式的定义,具体不做阐述,可自行百度。Path对象给定制marker提供了极大的便利,可以使用Path模块中已经定义好的一些Path类供用户组合,用户也可以自定义Path类 使用Path模块中的Path对象 import matplotlib.pyplot as plt import matplotlib.path as mpath import numpy as np star = mpath.Path.unit_regular_star(6) # 星型Path circle = mpath.Path.unit_circle() # 圆形Path # 整合两个路径对象的点 verts = np.concatenate([circle.vertices, star.vertices[::-1, ...]]) # 整合两个路径对象点的类型 codes = np.concatenate([circle.codes, star.codes]) # 根据路径点和点的类型重新生成一个新的Path对象 cut_star = mpath.Path(verts, codes) plt.plot(np.arange(10)**2, '--r', marker=cut_star, markersize=15) plt.show()
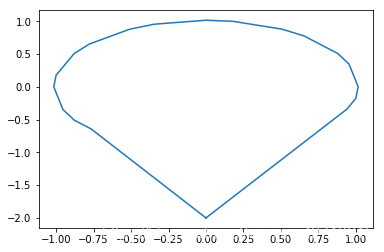
既然Path类的定义起源于svg,那么引申出一个问题,能否将svg格式的图片转化为Path对象?这样我们就不用费力自己定义Path对象,而是可以用别人已经定义好的svg格式的图片转换为Path对象 答案是可以的,可以用svgpath2mpl库解析svg转化为matplotlib的Path对象 import matplotlib as mpl from svgpath2mpl import parse_path import xml.etree.ElementTree as etree from six import StringIO import re # svg格式图片的svg代码 svg = """""" # 解析代码 tree = etree.parse(StringIO(svg)) root = tree.getroot() width = int(re.match(r'\d+', root.attrib['width']).group()) height = int(re.match(r'\d+', root.attrib['height']).group()) path_elems = root.findall('.//{http://www.w3.org/2000/svg}path') # 解析出每个Path对象 paths = [parse_path(elem.attrib['d']) for elem in path_elems] facecolors = [elem.attrib.get('fill', 'none') for elem in path_elems] facecolors = [c if c !="" else "none" for c in facecolors] edgecolors = [elem.attrib.get('stroke', 'none') for elem in path_elems] linewidths = [elem.attrib.get('stroke_width', 1) for elem in path_elems] #定义旋转矩阵 def rot(verts, az): #顺时针旋转 rad = az / 180 * np.pi verts = np.array(verts) rotMat = np.array([[np.cos(rad), -np.sin(rad)], [np.sin(rad), np.cos(rad)]]) transVerts = verts.dot(rotMat) return transVerts # 合并每个Path对象 verts = paths[0].vertices codes = paths[0].codes for i in range(1,len(paths)): verts = np.concatenate([verts, paths[i].vertices]) codes = np.concatenate([codes, paths[i].codes]) verts = rot(verts, 180) fig = plt.figure() ax = fig.add_subplot(111) ax.plot(verts[:,0], verts[:,1] , color="red") plt.show()
https://matplotlib.org/stable/gallery/lines_bars_and_markers/marker_reference.html#sphx-glr-gallery-lines-bars-and-markers-marker-reference-py https://nbviewer.jupyter.org/github/nvictus/svgpath2mpl/blob/master/examples/homer.ipynb |


【本文地址】
公司简介
联系我们
今日新闻 |
点击排行 |
|
推荐新闻 |
图片新闻 |
|
专题文章 |